ConfusionMatrix

Introduction

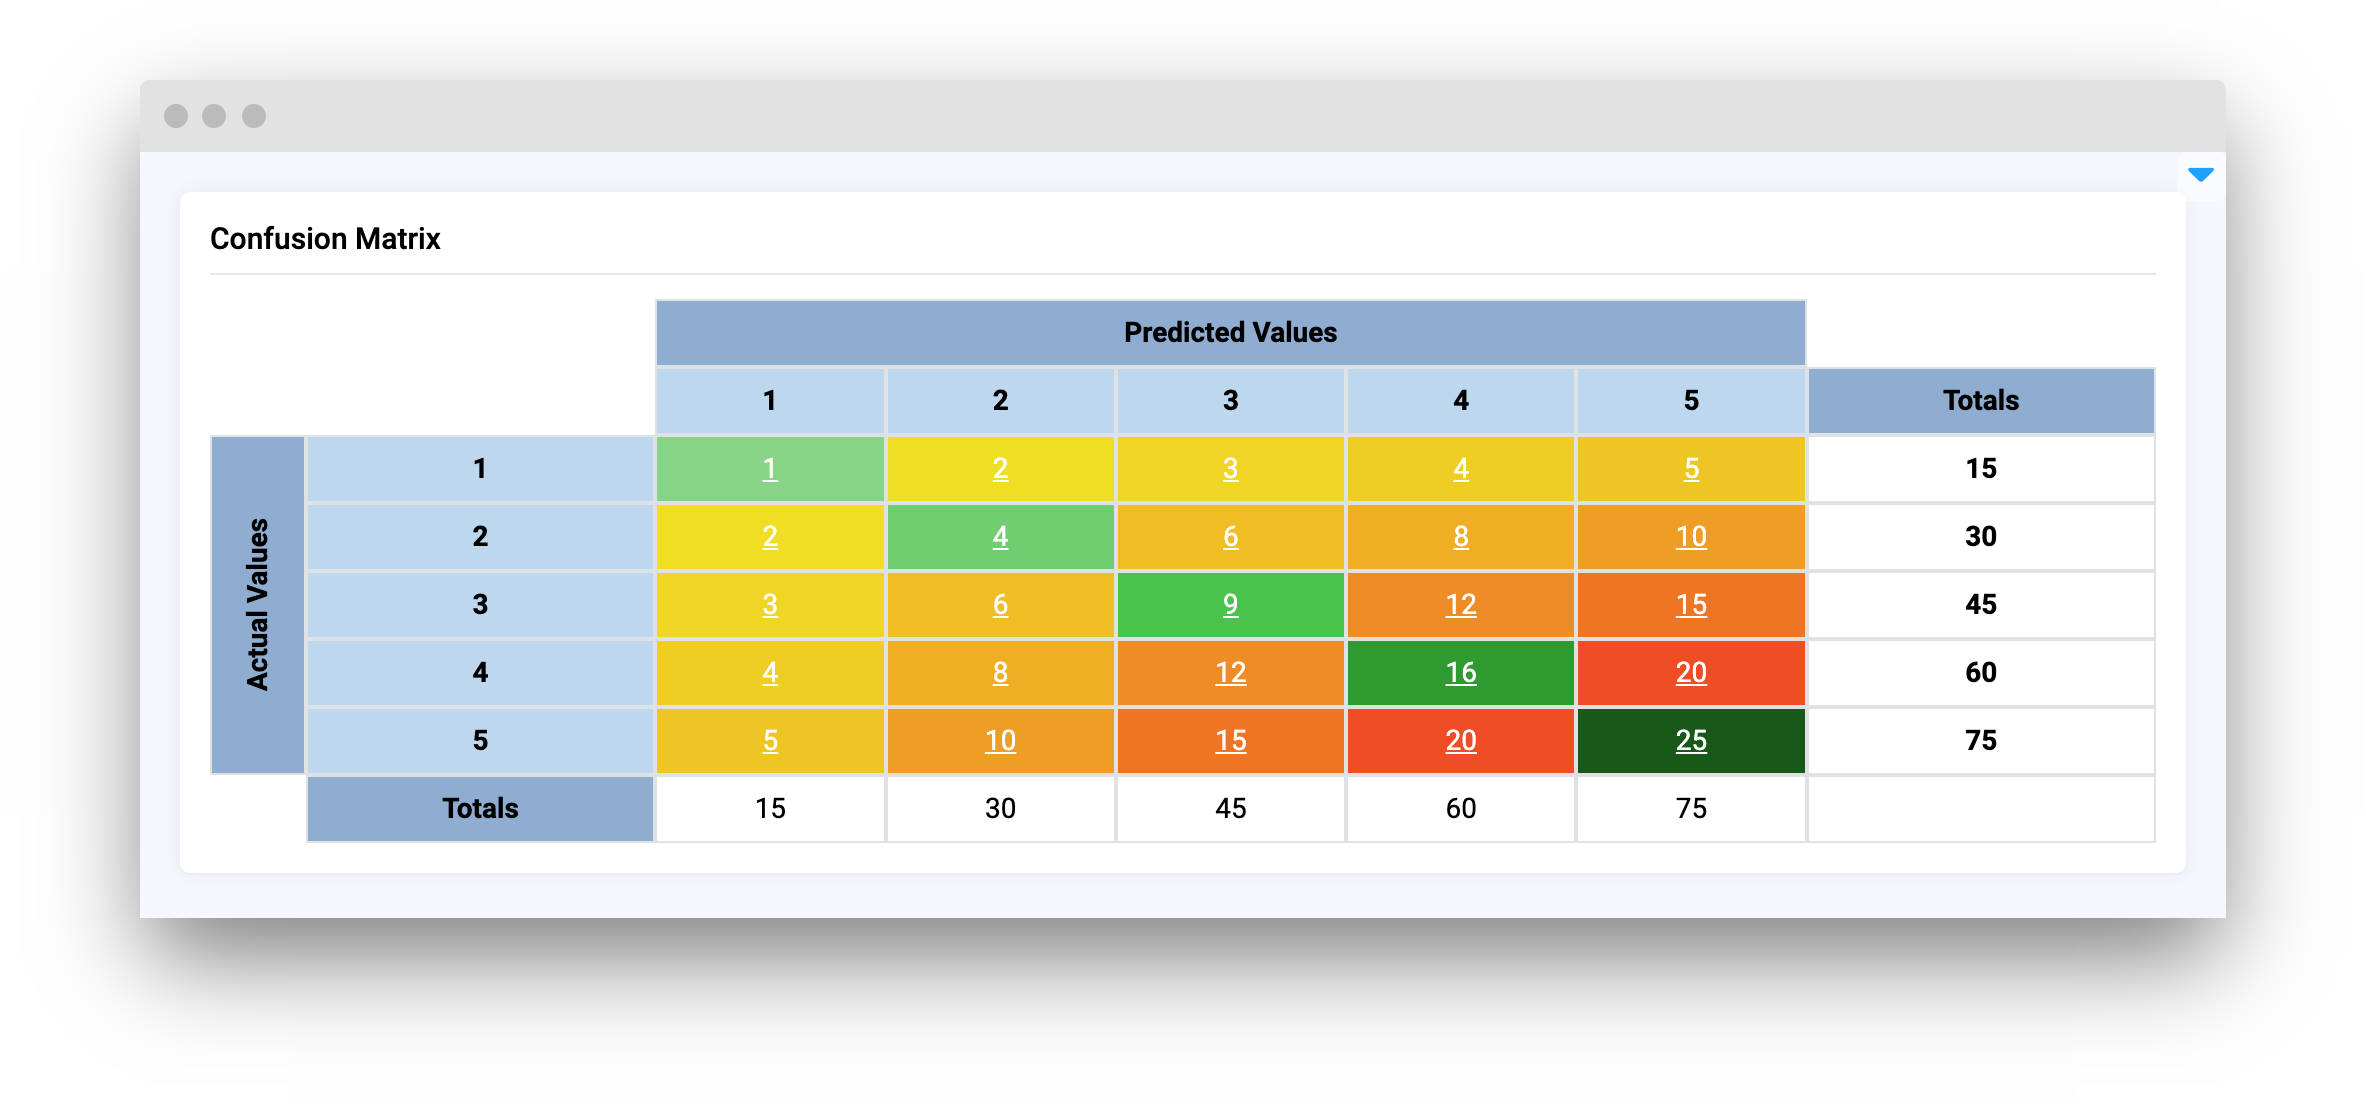
ConfusionMatrix is a widget that display a given confusion matrix with color-coded visualization for better interpretation. It also shows row and column totals.

ConfusionMatrix allows users to customize the axis labels, detect cell clicking events, and control it from Python code.

Function signature

prepare data for widget

a = list(range(1, 11))
b = list(range(1, 5))

data = []
for row in b:
    temp = [round(row * number, 1) for number in a]
    data.append(temp)
    
confusion_matrix = ConfusionMatrix(
    data=pd.DataFrame(data=data, index=b, columns=a),
    columns=a,
    x_label="X",
    y_label="Y",
    widget_id=None
)

or

confusion_matrix = ConfusionMatrix()
confusion_matrix.read_pandas(data=pd.DataFrame(data=data, index=b, columns=a))

Parameters

ParametersTypeDescription

data

pd.DataFrame() or dict

Matrix table data

columns

list

List of columns names

x_label

str

Columns label

y_label

str

Rows label

widget_id

str

ID of the widget

data

Matrix table data in different formats:

  1. Pandas Dataframe

pd.DataFrame(data=data, columns=columns)
  1. Python dict with structure
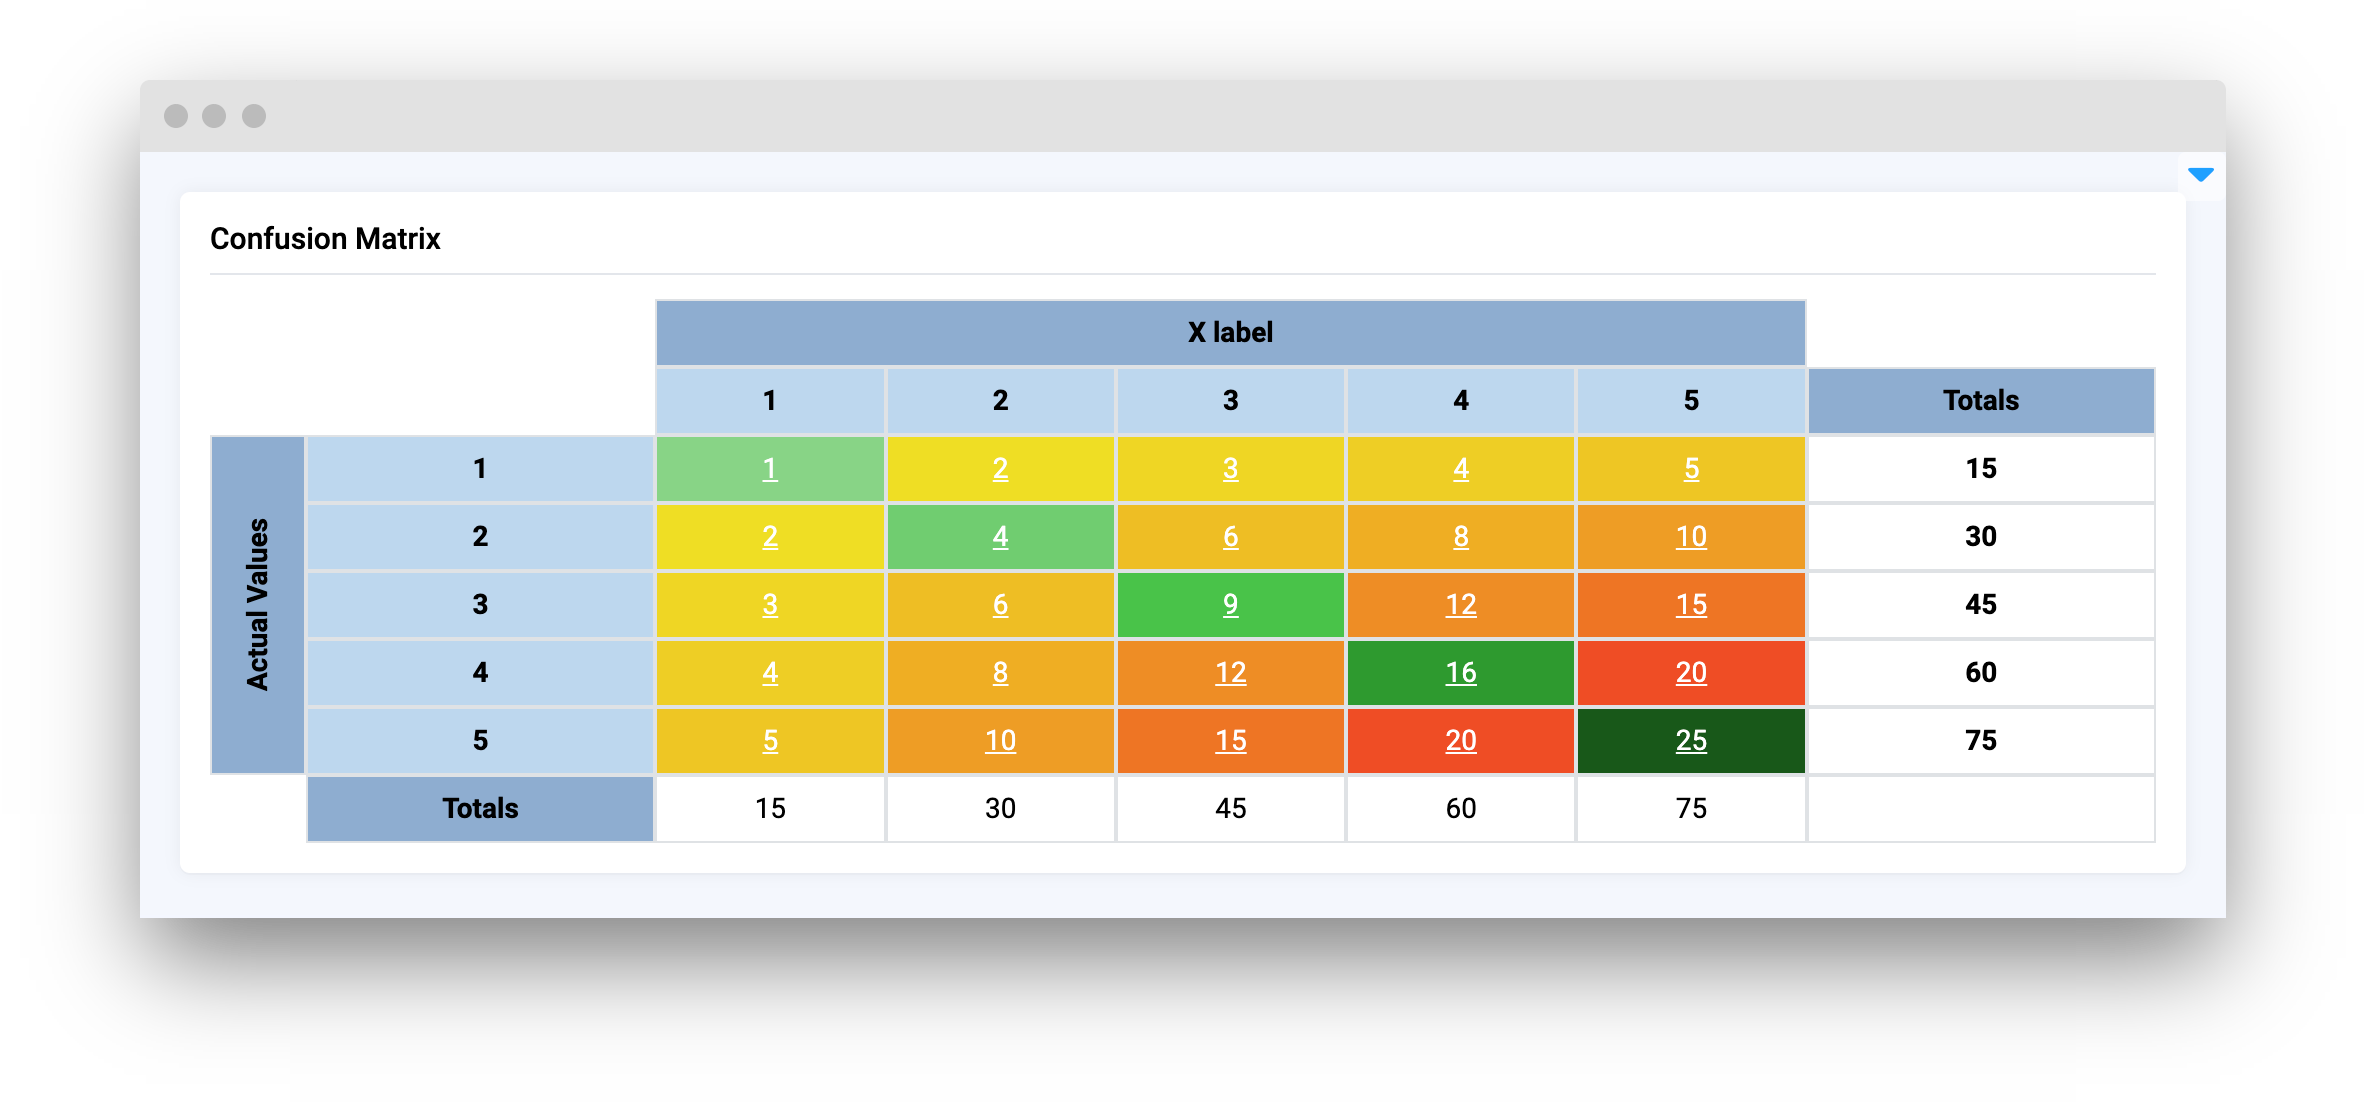
 {
    "columns_names": ["col_name_1", "col_name_2", ...],
    "values_by_rows": [
        ["row_1_column_1", "row_1_column_2", ...],
        ["row_2_column_1", "row_2_column_2", ...],
        ...
    ]
}

# prepare data for table
a = list(range(1, 11))
b = list(range(1, 5))

data = []
for row in b:
    temp = [round(row * number, 1) for number in a]
    data.append(temp)

a = [str(i) for i in a]
b = [str(i) for i in b]

data = pd.DataFrame(data=data, index=b, columns=a)

confusion_matrix = ConfusionMatrix(data=data)

x_label

Columns label.

type: str

default value: "Predicted Values"
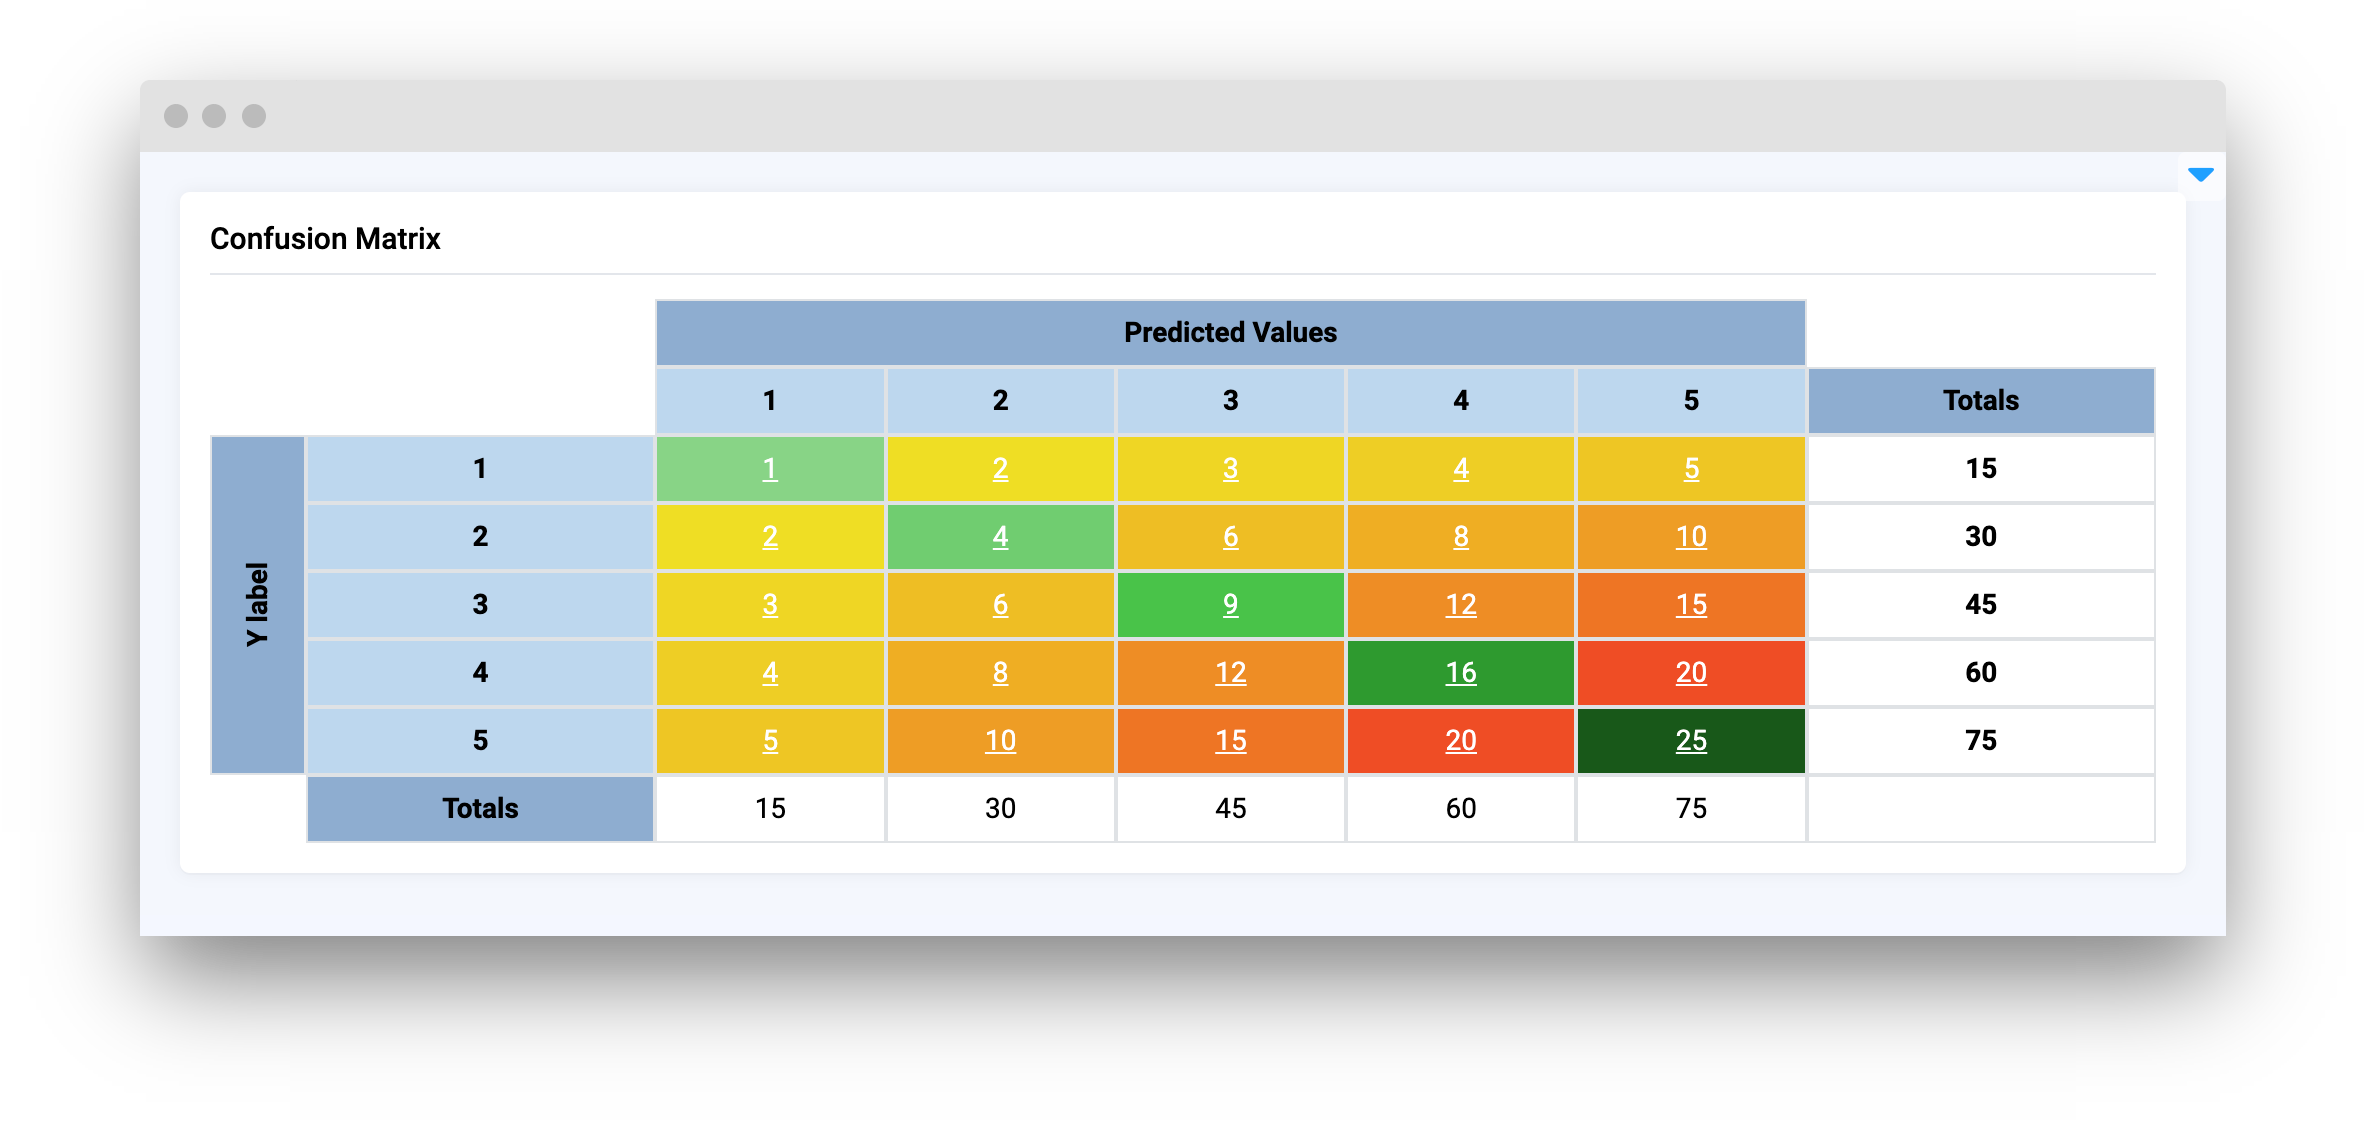
data = pd.DataFrame(data=data, index=b, columns=columns)

confusion_matrix = ConfusionMatrix(data=df, x_label="X label")

y_label

Rows label.

type: str

default value: "Actual Values"

data = pd.DataFrame(data=data, index=b, columns=columns)

confusion_matrix = ConfusionMatrix(data=df, y_label="Y label")

widget_id

ID of the widget.

type: str

default value: None

Methods and attributes

Attributes and MethodsDescription

loading

Get or set table loading status property.

to_json()

Convert table data to json.

to_pandas()

Convert table data to pandas dataframe.

read_json(value: dict)

Read and set table data from json.

read_pandas(value: pd.DataFrame)

Read and set table data from pandas dataframe.

get_selected_cell(state)

Get selected table cell info.

@click

Decodator function is handled when table cell is pressed.

Mini App Example

You can find this example in our Github repository:

ui-widgets-demos/charts and plots/004_confusion_matrix/src/main.py

Import libraries

import os

import pandas as pd
import supervisely as sly
from dotenv import load_dotenv
from supervisely.app.widgets import Card, ConfusionMatrix, Container

Init API client

First, we load environment variables with credentials and init API for communicating with Supervisely Instance:

load_dotenv("local.env")
load_dotenv(os.path.expanduser("~/supervisely.env"))

api = sly.Api()

Prepare function that creates example pandas table

def multiplication_table():
    a = list(range(1, 6))
    b = list(range(1, 6))
    # len(a) has to be equal len(b)

    data = []
    for row in b:
        temp = [round(row * number, 1) for number in a]
        data.append(temp)

    a = [str(i) for i in a]
    b = [str(i) for i in b]
    return pd.DataFrame(data=data, index=b, columns=a)

Create data for table.

df = multiplication_table()

Initialize ConfusionMatrix widget

confusion_matrix = ConfusionMatrix()
confusion_matrix.read_pandas(df)

Create app layout

Prepare a layout for app using Card widget with the content parameter and place widget that we've just created in the Container widget.

card = Card(
    title="Confusion Matrix",
    content=confusion_matrix,
)
layout = Container(widgets=[card])

Create app using layout

Create an app object with layout parameter.

app = sly.Application(layout=layout)

Last updated